Today we launch our seventh bi-annual transparency report, covering the period between July 1 and December 31, 2016.
As usual, we detail the number of takedown demands and requests for information received from governments, as well as the intellectual property (IP) takedown notices we have received.
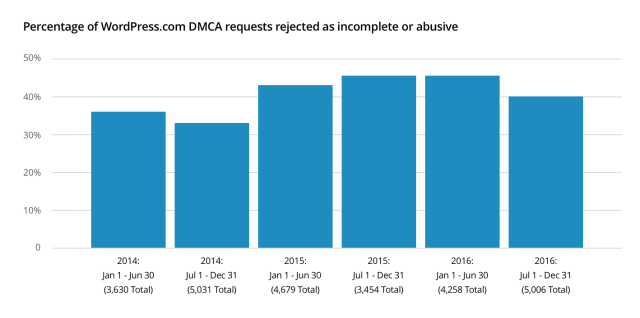
Having published these reports for a number of years now, something that is particularly striking is just how consistent the intellectual property figures are from one period to the next. To demonstrate this point, here are the percentages for the number of DMCA takedown requests we have rejected for each period, on the basis of being incomplete or abusive. The graphs include the total overall number of requests to provide some more context:
Looking just at the percentage of abusive notices received per reporting period, we see an even tighter range:
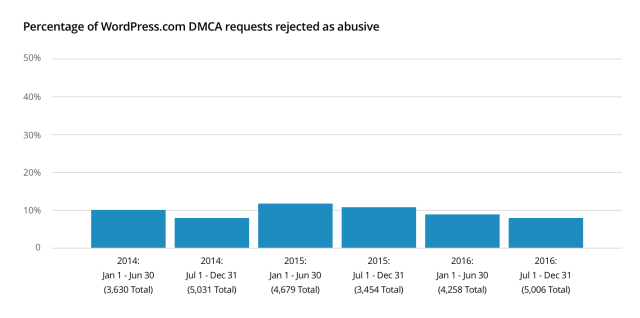
We believe that these numbers demonstrate a persistent and ongoing issue with the current copyright takedown system, which allows abuse to go unchecked due to a lack of real statutory consequences. Ten percent of notices on a single platform may not appear like much of a concern, but if our experience is representative of other similar hosts in the industry, the overall volume of abuse would amount to a huge number.
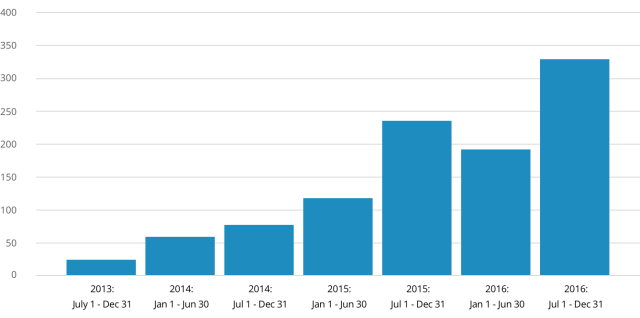
The same consistency seen in the IP numbers is not reflected in the percentage of government takedown demands that result in some or all content being removed as a result. Rather, these figures show a marked increase. This is partly due to a steadily climbing number of demands from countries such as Turkey and Russia, and also to a shift in our approach to handling these.
We encourage you to spend time looking through the data that we have collected, and dig in for yourselves. We’d also call on all hosts — big or small — to publish their own figures, and add their voice to the conversation.
The full transparency report is available here.
